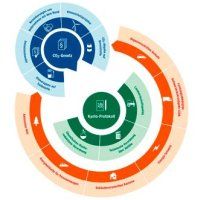
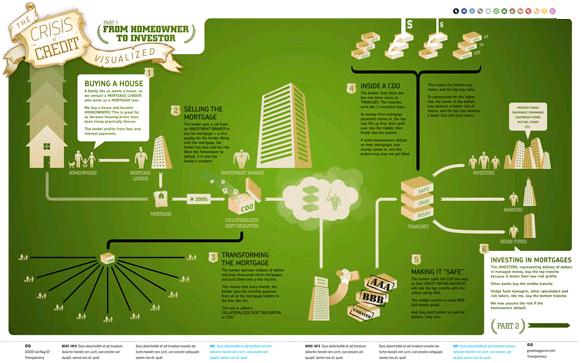
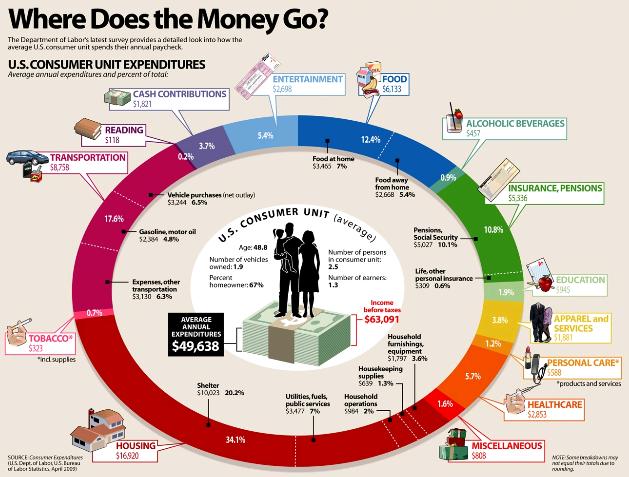
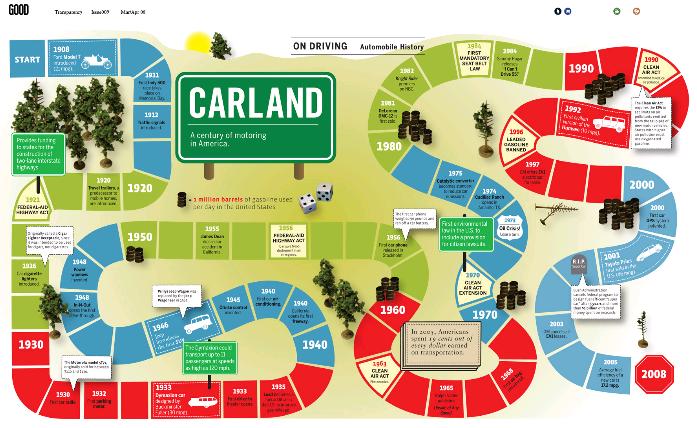
The internet has always needed progressively newer designs for its WebPages over the years since it came into being. The times of Web 1.0 weren’t different from the present era, the designers have always been pushed to their limits to define and re-define the styles, trends and environments of our online world. So, making eye-catching designs for these WebPages are always the top priority of designers.
So, cyber-world can be easily termed as a designers’ playground. More and more entrepreneurs are using the internet to grow their businesses. The reason for this is the great throughput of online businesses with just the right amount of “eye-candy”. Certainly though, this eye-candy must be used properly. A simple methodology has changed online business forever, “Infographics”.
Information Graphics (Infograhics) is the visual representation of data which can be used to demonstrate intricate information and data in a clear, concise and complete way. “Data viz” is another name used for this methodology is what most of the new generation call it these days. With infographics, data and information can be distinctively shown so that there’s no need to read, there’s just a need to see and visualize getting a complete understanding of what the designer wants to communicate. But, an infographic must not leave any space for self interpretation. Rather, it is needed to be designed in a way to portray a universal message so that everyone is at the same level of understanding.
Infographics can be visualized as some of the charts and graphs that most of us would have seen, and used too while using different Microsoft products like Word & PowerPoint. But, of course, as the time changes the trends change too. So, just as Web 1.0 has transformed into Web 2.0; the infographics today are much more sophisticated than the ones from yesteryear i.e. those simple pie charts and bar graphs.
These days the idea of infographics is to mesh-up many different data visualization techniques into one cohesive unit. The end result is good enough to draw the attention of the masses.
Many design trends have taken inforgraphics a long way during the past couple of years. This field has been given a much needed facelift with loads of creative mastery put in by designers. The internet today is brimming with enticing and beguiling ways of data viz.
While not many trends survive the wrath of an ever changing mindset of people, infographics is most likely here to stay. Many popular names are backing infographics as a source of efficient data visualization and its rise is eminent. It is evident this is going to become an important tool in the modern information age.
Well-established or a new-born, enterprises these days are turning their attention towards using infographics for marketing themselves over the internet. This makes them capable of reaching out to a wider audience and builds the reputation of their brand around the world. This is because a picture is worth a thousand words. Also, you don’t need to know any specific language to understand infographics. Thus, infographics can help a brand be recognized around the globe even where the people don’t speak your language.
In a nutshell, infographics is becoming one of the most popular and efficient data representation techniques used over the internet by many web designers. Thus learning how to use infographics is a must for any web/graphics designer wanting to make a mark on the market.
No related posts.
Related posts brought to you by Yet Another Related Posts Plugin.


Leave Your Response